


With the increasing demand for digitization and technological advancement, the importance of software QA metrics analysis has grown tremendously in recent times. The global market size was valued at USD 87 billion in 2021 and is expected to grow at a CAGR of 23.5% from 2021 to 2027. This growth in demand for quality assurance services can be attributed to the rise in the adoption of agile and DevOps methodologies, increasing use of mobile devices, and the need for continuous delivery of applications.
QA KPI metrics serve as indicators of the progress, allowing teams to measure their success in achieving the objectives set for the project. These metrics also help in identifying potential risks and issues that may arise during the process, enabling teams to take remedial actions to ensure that the project stays on track. In this article we’ll dive deep into terminology, types and use of QA performance metrics to make sure you observe your project development from all possible perspectives.
Quality Assurance Key Performance Indicators

Defect Density
This QA KPI metric is estimated by dividing the total number of defects by the product’s size, usually in terms of function points/ code lines. Testers use it to identify quality issues areas, such as where the code is convoluted or difficult to maintain.
By tracking detect density over time, teams monitor the effectiveness of their development processes and improve them. For instance, when defect density is increasing, it indicates that development is rushed or that code is pushed to production without adequate QA testing metrics analysis. In contrast, a declining defect density over time shows that improvements are being made to development processes, such as better code reviews or improved quality control.
Test Coverage
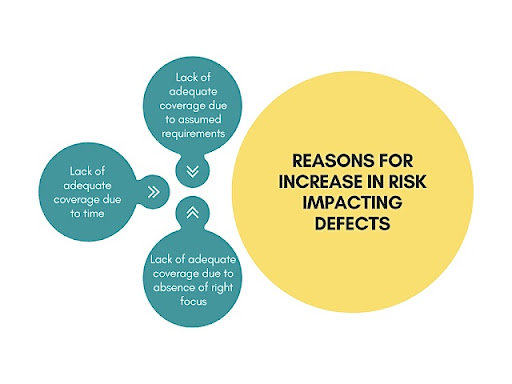
This indicator is essential in refactoring or modifying code where new risks and vulnerabilities may emerge. With test coverage, a development team can ensure that they have tested all the possible scenarios in their application to ensure a smooth deployment and boost other quality assurance key performance indicators of their product. Basically, test coverage guides the development team to ensure the application meets the required quality standards and was tested enough.
Test Case Effectiveness
The next quality assurance metric measures the number of defects identified by test cases compared to the total number of defects present in the system. High TCE indicator means that the qa performance testing is comprehensive, and the defects are relevant to the system. Elsewhere, low test case effectiveness may suggest that the tests were not thorough enough, and improvements may be needed.
Defect Escape Rate
DER calculates the number of defects that are found by end-users after a product has been launched into the market. A high defect escape rate indicates that a company’s testing is not effective in catching all potential defects before they are released. It may result in customer dissatisfaction, decreased sales, and damage to the company’s reputation.
Mean Time to Detect
MTTD is a QA performance metric that measures the approximate time it takes to find an issue or defect in a system. MTTD enables organizations to evaluate and refine control procedures, helping to reduce the risk of defects and increase customer satisfaction. By tracking MTTD, companies can also improve their response time to identify and fix issues, resulting in a better overall user experience.
Mean Time to Repair
MTTR defines the average time it would take for a system to recover after a failure, reducing potential downtime and costs, while at the same time improving the overall level of service offered to customers. This QA performance metric can be used to evaluate the efficiency of a company’s maintenance program, identify specific areas that require improvement and help to streamline processes.
Test Execution Productivity
This QA testing metric is a valuable tool for measuring the effectiveness of the entire process, including planning, preparation, and implementation. By monitoring test execution productivity, teams can adjust their approach to ensure that they are achieving their goals efficiently and effectively.
Test Automation Coverage
Test automation coverage is a QA metric that is used to measure the percentage of automated tests that cover a particular application’s functionality. It is helpful in ensuring that every aspect of an application is tested and that any defects or issues are identified and resolved before deployment. The higher the test automation coverage, the more automated test cases an application has, and hence the more comprehensive the process is.
Test Environment Stability
It focuses on the availability and reliability of the platform, infrastructure, and resources needed to conduct software delivery in a consistent and predictable manner. By assessing environment stability QA KPI metrics, such as uptime, availability, and response times, development teams can identify and address any issues that may impact the accuracy and reliability of their results.
Requirement Stability
This indicator is important because changes to requirements can lead to delays, higher costs, and reduced customer satisfaction. Requirement stability can be calculated by tracking the number of changes made to the requirements, as well as the time frame within which the changes occur. Software development teams can use requirement stability to identify areas where requirements are changing frequently, and to prioritize their efforts accordingly.
Customer Satisfaction
Customer satisfaction is a metric used to evaluate whether a product or service meets customers’ expectations and needs. It is commonly measured through surveys or feedback gathered directly from customers. The overall aim of measuring customer satisfaction is to improve the customer experience, retention, and loyalty. Moreover, customer satisfaction plays a crucial role in promoting brand reputation and word-of-mouth marketing, leading to sustainable business growth.

Test Case Stability
It assesses the degree to which the test cases remain unchanged, or if any modifications are made they do not significantly affect the outcome of the test. Test case stability ensures that the process is dependable, and the software products are consistent and trustworthy. A high level of test case stability enhances the efficiency and effectiveness of testing, as it reduces the need for additional resources and time to retest.
Specifying QA Metrics
There are two main styles of software development testing: manual and automated. Manual testing is being conducted manually, often with a human tester going through each feature and checking for errors or bugs. Automated one, on the other hand, involves using software to test the software. Some developers prefer a combination of both methods, using manual for certain features and automated for others.

Above-mentioned QA metrics examples provide measurable values that can help in making data-driven decisions and address potential issues. However, it is essential to carefully choose the right indicators based on the specific project and adjust them accordingly to ensure that they align with the project goals and requirements. This ensures that the project team is focused on the right areas, enabling them to achieve the best possible outcomes.
In Conclusion
QA performance metrics provide an insight into what’s going well and what areas require attention. However, relying solely on metrics isn’t enough. Choosing a trusted quality assurance vendor is equally important. QA vendors are experts in ensuring that products, services or systems perform seamlessly. They have specialized knowledge and experience in the field and can provide valuable insights, recommendations, and feedback. Finding a reputable vendor can be challenging, but it’s worth the effort as it can save businesses time, money and minimize risks.